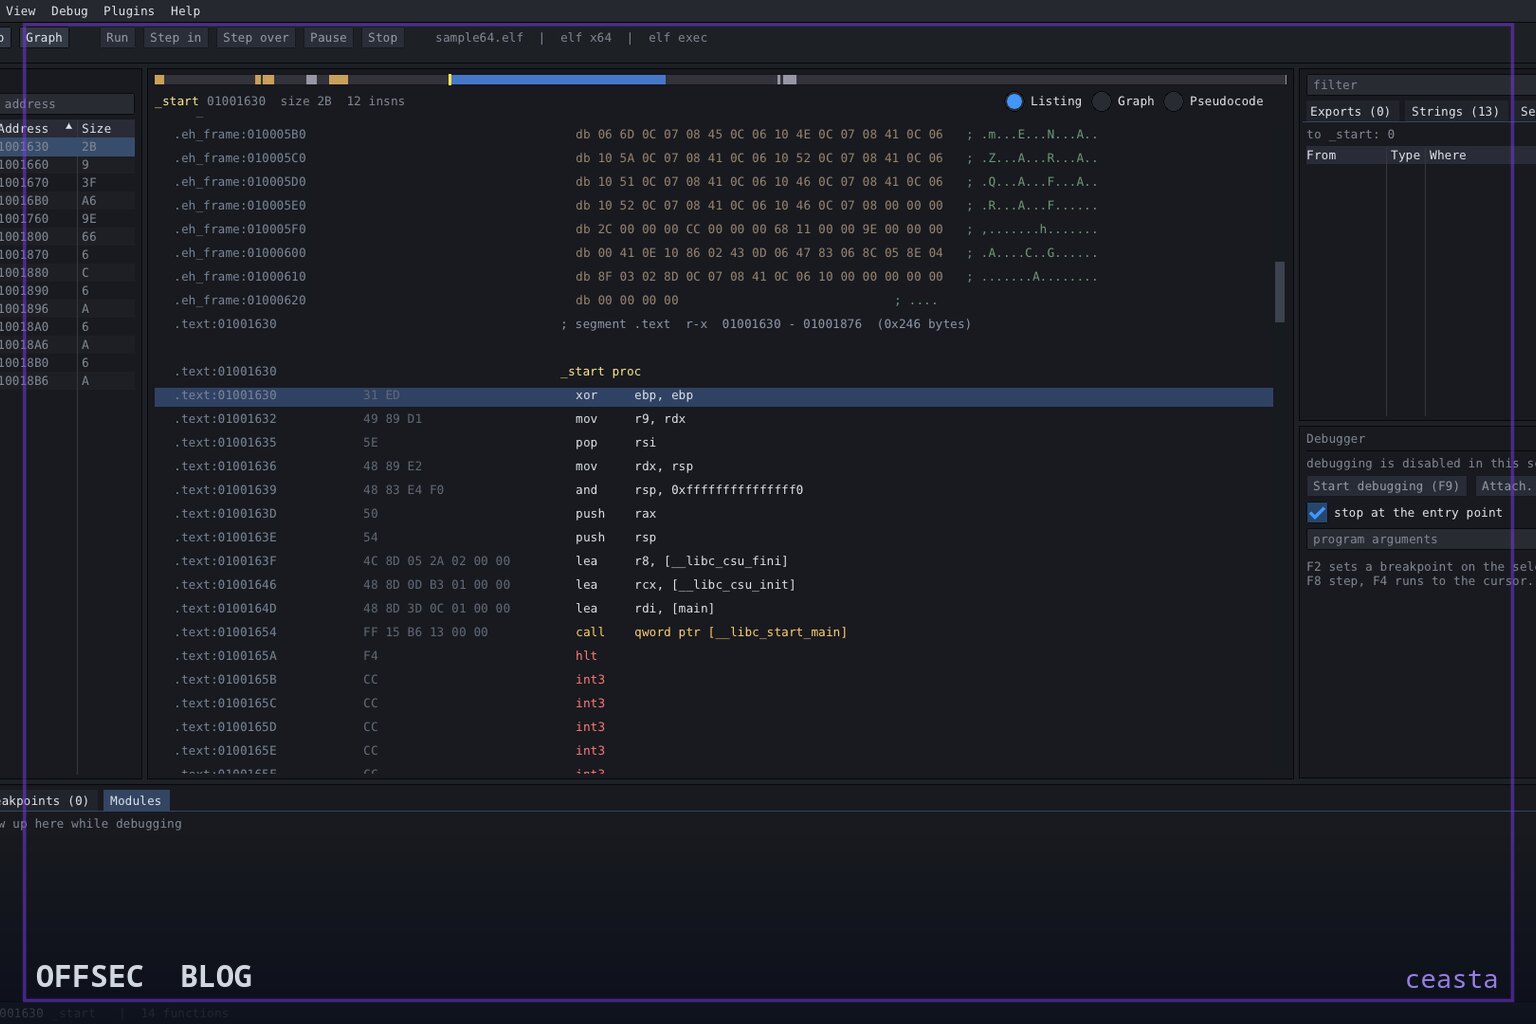
ceasta combines an IDA-style disassembler, a best-effort decompiler, an x64dbg-style debugger and a built-in MCP server so authorized analysts can point an AI at a binary.
| Tool | ngwg/ceasta — single-binary disassembler, decompiler and debugger for Windows and Linux with a built-in MCP server |
| Category | Reverse-engineering workbench (static + dynamic analysis, AI-assisted via MCP) |
| Primary Use | Analyzing PE and ELF binaries and raw shellcode in authorized malware triage, CTF work and vulnerability research, with lua scripting and ceasta-cli for CI automation |
| Safe Use | For professionals examining software they own or are explicitly authorized to assess — malware analysis in isolated labs, CTF challenges, first-party binary auditing, and defensive research |
| Telemetry Note | Purely local tooling: it reads files, runs them under ptrace/Win32 debug API, and serves analysis over localhost http://127.0.0.1:8744/mcp; it beacons nowhere and leaves project state only in .ceasta files the analyst saves |
ceasta is a refreshingly consolidated answer to a question reverse engineers usually need three tools to answer: what does this binary do statically, what does it look like as pseudocode, and what does it actually do at runtime. The project, written in C++17 and licensed GPL-3.0, packs an IDA-style listing, a decompiler, a function graph, an x64dbg-flavored debugger, lua plugins and — the headline feature — a built-in MCP server that lets an AI assistant like Claude Code or Cursor operate on the open binary. Everything is vendored: imgui, capstone (x86 only) and lua 5.4 ship in third_party/, so a build needs nothing but a compiler.
The scope of the loader layer tells you a lot about intent. ceasta opens PE files — exe, dll, sys, both 32- and 64-bit — plus ELF for x86 and x64, and raw shellcode with no container at all. That last one matters for malware triage, where you frequently have a dumped blob rather than a well-formed executable. Cross-platform reach is symmetric: the Linux CLI happily reads Windows PE files, so you can do initial triage of a Windows sample from a Linux analysis box without spinning up a VM first.
Auto-analysis covers the foundations an analyst expects before touching a key: function discovery from entry points, exports, symbols, .pdata, TLS callbacks, call targets and pointers in data; switch table recovery; cross-references; ASCII and UTF-16 strings; imports and exports; thunks; and noreturn call propagation. The listing itself follows the IDA idiom — names instead of raw addresses, labels, and xref and string comments inline — which matters because the decompiler is explicitly described as best-effort. There are no types or structs yet, so pseudocode shows registers and casts rather than clean signatures, and the README is candid that the listing remains the source of truth. The worked checksum example in the README — where the pseudocode reduces to djb2, with 0x1505 being 5381 and (h << 5) + h being h * 33 — is a good demonstration of the intended workflow: use f5 to get the shape of a routine fast, then drop back to the assembly when precision matters.
The debugger story splits by platform. On Windows you get a full GUI debugger built on the Win32 debug API, with 32-bit targets handled via wow64, plus breakpoints, step into/over with a configurable instructions-per-press, run to cursor, live registers, stack and memory views. On Linux the debugger is a terminal interface inside ceasta-cli dbg, built on ptrace — described honestly as basic but real, and best on single-threaded targets. Two features stand out for dynamic work: while stopped in a function, the decompiler highlights the current pseudocode line, which bridges static and dynamic views; and trace records indirect call targets as xrefs, retroactively enriching your static database with runtime evidence. There's also function calling into the live process, which in a lab context is the classic trick for invoking an isolated decrypt routine without reimplementing it.
The MCP integration is what makes ceasta more than another IDA clone. From the AI menu (or ceasta-cli mcp), the tool serves the open binary over http://127.0.0.1:8744/mcp, and the AI client can decompile, read xrefs, rename functions and diff builds — its renames and comments appear in the UI in real time. With the debugger explicitly allowed via --allow-debug, the AI can additionally set breakpoints, step, read memory and call functions in the running program. That opt-in gate is the right design: the destructive capabilities are separated from the read-only analysis surface, and the README points to a dedicated docs/mcp.md guide covering the debugger tools and safety notes. The local binding means nothing leaves the analysis box.
Automation comes through two channels. ceasta-cli exposes the whole analysis pipeline non-interactively — info, funcs, disasm, graph, decompile, xrefs, find with byte patterns like "48 8b ?? 05", search across names/imports/strings/comments, and run for scripts — which slots cleanly into CI for build-diffing or regression triage. The lua API (documented in docs/lua.md) covers functions, xrefs, naming and logging, with a live prompt in the output panel; five plugins ship in the box, including a crypto finder, a wrapper namer, a strings reporter and a debugger-driven call tracer. Both channels are read/annotate-oriented rather than patch-oriented, which keeps the tool on the analysis side of the line.
Two of the more mature features deserve separate mention. The binary diff (ceasta-cli diff) matches functions between two builds and shows what changed — the bread-and-butter workflow for patch-diffing vendor updates in authorized vulnerability research, or comparing malware variants. Library signatures (sigmake / sigapply) let you generate signatures from a symbolized library like libc.a and apply them to a stripped binary to recover names for statically linked known functions, dramatically cutting the cold-start cost on stripped targets.
The GUI is a single-window layout — functions on the left, listing/graph/pseudocode in the middle, imports/exports/strings/segments/xrefs and the debugger panels on the right, output and lua console at the bottom — with imgui doing the rendering. Keybindings mirror the IDA dialect: f5 for pseudocode, space to toggle listing and graph, n to rename, ; to comment, x for references, f2 for breakpoints. Projects save to .ceasta files next to (or wherever relative to) the binary, persisting names, comments and breakpoints. The Windows app ships as an installer that needs no admin, or a portable zip; the Linux download is CLI-only, with an experimental glfw + opengl GUI in the tree that you must build yourself.
For defenders and authorized assessors, ceasta earns its place through the MCP angle alone: it turns AI-assisted reverse engineering from pasted disassembly snippets into a grounded loop where the model reads real xrefs and real decompilation from the actual database. Combined with a zero-dependency build, honest documentation of its decompiler's limits, and a debugger that feeds runtime facts back into static analysis, it's a credible lightweight bench tool for lab work — provided you keep the --allow-debug capability confined to disposable, isolated targets you own.
ngwg/ceasta.Educational analysis for authorized security professionals. Use only in controlled, authorized environments.

0 comentários:
Post a Comment
Note: Only a member of this blog may post a comment.