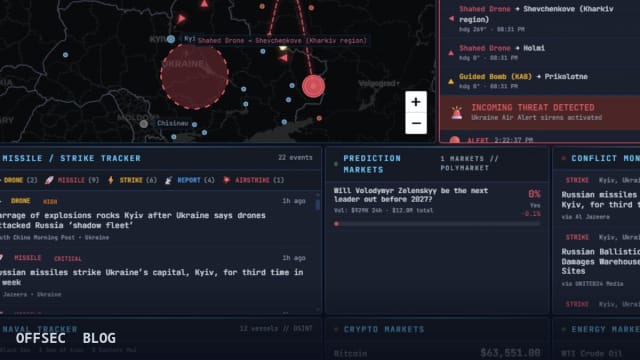
IRONSIGHT is a self-hosted, key-free OSINT dashboard that fuses news RSS, Telegram, air-raid alerts, ADS-B, and satellite thermal feeds into one theater-aware map for analysts monitoring active conflicts.
| Tool | NoblerWorks-HQ/IRONSIGHT — real-time OSINT command center aggregating 50+ public feeds into a two-theater conflict dashboard |
| Category | OSINT aggregation / situational-awareness dashboard (Next.js, TypeScript) |
| Primary Use | Running a self-hosted fusion view of open-source conflict intelligence — Telegram channels, RSS, air-raid alert mirrors, ADS-B tracks, NASA FIRMS thermal data — for research and monitoring |
| Safe Use | Intended for analysts, journalists, researchers, and authorized security teams conducting open-source, publicly available data analysis in lab or research environments; it is a passive viewer of public feeds, not an attack tool |
| Telemetry Note | The tool makes no attempt to hide itself: it polls public endpoints (adsb.lol, CoinGecko, Google News RSS, Telegram embeds) at fixed 15s–10min intervals from the host running it, so its footprint is visible in egress logs; defenders studying it should note it only reads, never interacts with, targets |
IRONSIGHT is a TypeScript dashboard built by Nobler Works that positions itself as a real-time OSINT command center for monitoring active conflicts. The project, hosted at NoblerWorks-HQ/IRONSIGHT under an MIT license and written in TypeScript on Next.js 16 with the App Router, aggregates a strikingly broad set of publicly available feeds into a single interface: news RSS, public Telegram channels, military aircraft ADS-B data, naval vessel positions, air-raid alert mirrors, drone and missile track data, satellite thermal anomaly detection, and financial/prediction markets. What makes it notable architecturally is that it requires no API keys at all — every data source it consumes is free and publicly accessible, which dramatically lowers the barrier to running a capable intelligence-fusion view locally.
The core UX decision is the theater toggle. A switch in the header flips the entire dashboard between the Iran/Israel and Russia/Ukraine conflicts, and every panel, map layer, and data feed re-points to the selected theater, with the choice persisted across browser reloads. This is not a cosmetic filter — the README describes it as a full re-pointing of the underlying data pipeline, so an analyst monitoring one conflict can pivot to the other without reconfiguring anything. The design reflects a deliberate architecture where theater-specific configuration lives separately from the rendering and polling machinery.
Under the hood, each conflict is a config object under src/lib/conflicts/ describing everything theater-specific: map center and cities, keywords, RSS feed lists, Telegram channel sets, alert provider, and geographic bounding boxes. A React context (useConflict) exposes the active conflict to the UI, and a useConflictFeed hook appends the selected conflict identifier to every API request so the backend routes serve the correct theater's data. The README is explicit that adding a new conflict is mostly a matter of adding a config file and registering it — a clean separation of concerns that makes the codebase extensible to other geographic situations without touching the core engine.
The polling strategy is tiered by data volatility, which reveals genuine operational thinking. Air-raid alerts from the Israeli Home Front Command mirror (Tzeva Adom) and Ukrainian oblast alerts via alerts.com.ua are polled every 15 seconds because sirens are the most time-critical signal. The drone/missile tracker pulling from neptun.in.ua runs at 20-second intervals, Telegram channels and the regional threat monitor at 60 seconds, news RSS at 90 seconds, strikes every 2 minutes, conflicts and flights every 3 minutes, naval positions every 5 minutes, and markets, crypto, Polymarket odds, and NASA FIRMS fire data every 10 minutes. This graduated cadence matches the refresh rates of the upstream providers rather than hammering them needlessly.
The Telegram integration deserves specific attention because it is the most sensitive component. IRONSIGHT scrapes public channels only, via Telegram's public embed endpoint, with automatic translation of Hebrew, Arabic, Farsi, Ukrainian, and Russian content through Google's unofficial translate endpoint. The channel lists are extensive and ideologically diverse by design: for the Eastern Europe theater they include Ukrainian official channels like UA General Staff and kpszsu, Russian state media and war correspondent channels like RIA Novosti, Readovka, and WarGonzo, independent Russian outlets like Meduza and Astra, and OSINT aggregators like DeepState UA and Rybar. The Middle East set similarly mixes IDF official channels with Iranian state and IRGC-adjacent sources. The README notes channels are periodically activity-checked, with the Russia/Ukraine set last verified in July 2026 — an admission that channel churn is a real maintenance burden.
The map layer is built on Leaflet and React-Leaflet with CARTO Dark Matter basemap tiles over OpenStreetMap data and country border lines from Natural Earth's ne_50m_admin_0_boundary_lines_land dataset, both properly attributed. Rendered on top are military aircraft positions from adsb.lol filtered to the theater's region, known naval vessel positions scoped to the relevant waters (Persian Gulf/Red Sea/Eastern Med or Black Sea/Sea of Azov), strike markers geocoded from news and Telegram posts, missile trajectory arcs, range rings, and a distance-measurement tool. For the Russia/Ukraine theater specifically, a live drone and missile tracker renders real-time Shahed drone, cruise/ballistic missile, and glide-bomb (KAB) tracks with heading, movement trails, and confidence indicators, sourced from Neptun.
The non-geospatial panels round out the situational picture in ways that mirror how professional analysts actually triage events. A live intel feed aggregates per-theater RSS with relevance filtering that strips sports and entertainment noise. A conflict monitor categorizes events into strikes, defense, diplomatic, and nuclear categories with per-theater geocoding. A missile/strike tracker applies weapon-type classification and severity scoring. The financial panels — defense contractor stocks, indices, VIX, gold, oil futures via Yahoo Finance, crypto via CoinGecko, and Polymarket prediction odds — function as a crowd-sentiment and market-reaction barometer, which is a legitimately clever OSINT signal: markets and prediction markets often react to escalation before mainstream reporting confirms it.
The satellite thermal detection panel uses NASA FIRMS fire and explosion detection data, region-filtered per theater. This is a well-established open-source technique — thermal anomalies visible from MODIS/VIIRS sensors can corroborate reports of strikes or explosions independently of human reporting — and the README correctly credits NASA as the data owner. Combined with the air-raid alert audio notifications and on-map siren arcs, the dashboard gives an analyst multiple independent confirmation channels for any single reported event, which is exactly what good OSINT verification practice demands.
Getting started is refreshingly minimal. The only prerequisite is Node.js 22, pinned via the repository's .nvmrc file, with no API keys or environment variables required. Running npm install followed by npm run dev brings up the development server on localhost:3000, and npm run build plus npm start handles production. For those who prefer isolation, a multi-stage Dockerfile produces a roughly 215 MB standalone image running as a non-root user, launchable with docker compose up --build — a sensible sandboxing choice given the tool constantly polls third-party endpoints.
The README is unusually forthright about data ownership, repeatedly emphasizing that IRONSIGHT is a viewer, not a data owner, and that every feed surfaced belongs to its respective provider with attribution preserved. This matters for professional use: analysts republishing or acting on dashboard-derived information should trace claims back to the original source, since IRONSIGHT explicitly makes no claim about data accuracy and merely surfaces third-party content unmodified in substance. The mixing of state propaganda channels alongside independent reporting is a feature for analysts who need to monitor adversary narratives, but it means nothing on the dashboard should be treated as verified ground truth without corroboration.
For authorized security teams, journalists, and researchers, the legitimate use case is clear: a self-hosted, privacy-controlled aggregation point for monitoring publicly available conflict information without relying on any single provider's portal. Because it runs locally and polls only free public endpoints, it leaves the analyst in control of their own footprint — though anyone operating it should be aware that the fixed polling intervals generate a consistent, identifiable pattern of outbound requests to news, finance, and social endpoints from the host machine. As an educational exercise in feed-fusion architecture, the conflict-config pattern under src/lib/conflicts/ is worth studying by anyone building multi-source monitoring dashboards for defensive or research purposes.
NoblerWorks-HQ/IRONSIGHT.Educational analysis for authorized security professionals. Use only in controlled, authorized environments.
Related coverage


0 comentários:
Post a Comment
Note: Only a member of this blog may post a comment.